Consulting the QMS History
QMS keeps all measurements, actions, and calibrations in the history database. Next to the proofing validation, this database also includes calibrations, proofer checks, proof to reference, and profiling.
To consult the QMS History
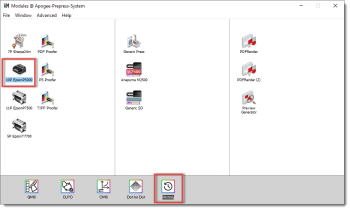
1 Select a Proofer (e.g. Epson P5000)in the Output section of the modules window and double-click History.
 |
2 The History window appears.
The left-hand pane displays all measurements in chronological order. The measurements can be filtered on Inkset, Media Types, and Quality.
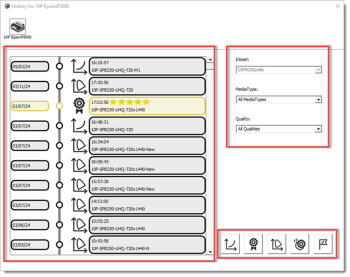 |
You can enable and/or disable following actions. Hold the Alt key while clicking one of the buttons to only enable the requested option.
• Calibration
Calibration• Proofer Check
Proofer Check• Profile Creation
Profile Creation• Profile Reference
Profile Reference• Validation
Validation3 Double-click on the measurements/scores to access the details of the entry and open the reports. Refer to Calibration, Proofer Check, Profile Creation, Profile Reference, and Validation Reports.
 |
Calibration
 |
A calibration is an update of the proofer quality to bring it into a controlled state, ensuring that the output is suitable for printing. This process compensates for variations such as fluctuations in media/ink batch and environmental conditions.
1 Double-click on a calibration.
QMS displays the measurement data in Lightness (light to dark) or Chroma (color saturation of yellow/orange).
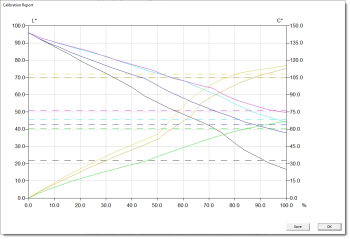 |
An Epson printer utilizes varying tints and droplet sizes (partial inks) to construct the color from light to dark. A slight decrease in the curve is an indication of the commencement of the lighter partial ink's decline, while the heavier ones begin to increase. Significant decreases are indicative of an underlying issue, such as missing nozzles or incorrect tints.
Proofer Check
 |
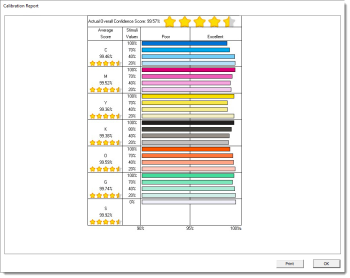
A proofer check is a routine that prints a small strip with a limited range of colors. The wedge can be measured to determine whether the calibration is still accurate.
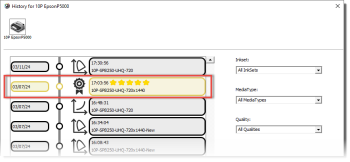
1 Double-click on a proofer check.
QMS opens the proofer check report. The report displays an overall confidence score, as well as per ink and for the media. The values (and number of stars) express how good the output of the printer matches the reference values used as aim values during calibration. Confidence scores below 95% indicate poor calibration status, and should be avoided by recalibrating the proofer.
 |
Profile Creation
 |
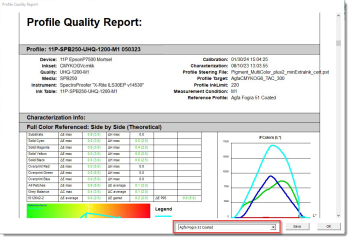
For each QMS created profile, a quality report will be added into the history database. A quality report is a mathematical evaluation of the proofer profile compared with a press condition (press profile).
1 Double-click on a profile creation.
QMS displays the profile quality report. Select a press profile from the drop-down list at the bottom. The proofer profile is compared with the selected press profile.
 |
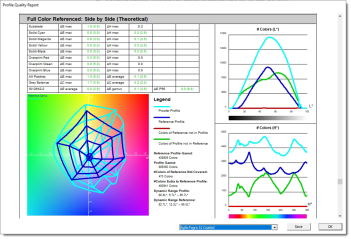
Profile Quality Report
The profile quality report enables a comparison of the color gamut of a proofer profile with the press profile. This can be used to predict the adequacy of the proofer profile to accurately reproduce the reference profile.
The following proofer profile's parameters are listed in the details:
•Device: the proofer linked to the proofer profile
•Ink set: inks used
•Quality: resolution and print parameters used
•Media: media type name
•Instrument: measurement device used for measuring the profiling target
•Ink table: calibration used
•Calibration: the time stamp of calibration used to create the profile
•Characterization: the time when the profiling target was measured
•Profile steering file: how a profile has been calculated from the measurements
•Profiling target: measured wedge
•Profile ink limit: additional limitation of the total ink to avoid drying issues and improve measure quality
•Measurement condition: measurement mode of the device
•Reference profile: the profile compared with the proofer profile (press condition)
•Characterization info: side-by-side comparison. A side-by-side comparison is a theoretical absolute colorimetric comparison between the proofer and press profile. The numbers in the table contains color differences between the proofer profile and the press profile based on a virtual IS12642-2 target using the tolerances of the ISO12647-7:2016 Proofing Standard (DE(00)).
Graphics
The same color encoding is used for all graphics:
•Cyan: Proofer Profile color
•Blue: Reference colors (Press Profile)
•Red: Colors that are in the Reference Profile, but not in the Proofer Profile
•Green: The color in the Proofer Profile, but not in the Reference Profile.
Graphics on the right side represent the amount of colors for the two profiles:
•The top graphic shows the distribution of the amount of colors (gamut size) from dark (left side) to white. The higher the curve, the higher the amount of color for a given L* (lightness) value. Here, the Green curve represents the amount colors of the Proofer Profile that exceed the gamut of the Press profile per lightness level. The Red curve shows the colors that are missing in the Proofer Profile compared to the Press Profile.
•The lower right graphic shows the distribution of the amount of colors per Hue level (color angle). The Green curve represents the amount colors of the Proofer Profile that exceed the gamut of the Press profile per color hue (angle).
The Spider view (lower left graphic) provides a top-down view of the color gamuts, with the white point of the Proofer Profile at its center. A shifted Blue web (Reference Profile) indicates a tinted substrate, with the "arms" of the web representing the pure and overprinted colors. For a standard Press Profile, these are the primaries Cyan, Magenta, and Yellow, with overprinted colors Red, Green, and Blue, and intermediate steps such as highlights, mid-tones, and shadows. Proofer Profiles may be more complex with additional "arms" representing multicolor inks (e.g., Orange, Green, and Violet) and their corresponding secondary colors. The endpoints are the saturated 100% colors, and ideally, all Blue endpoints should be within the Cyan web, indicating that the saturated colors will fit within the Proofer Profile.
Profile Reference
 |
A proof-to-reference test compares a measured wedge with a stored reference in the past.
1 Double-click on a profile reference.
QMS displays the proof to reference report. The proof to reference report is an internal defined standard that compares an original proofer measurement with the current situation. A good proof to reference can be used as a guide for further production whereas and a bad proof to reference score indicates that the proofer profile or calibration needs to be updated.
 |
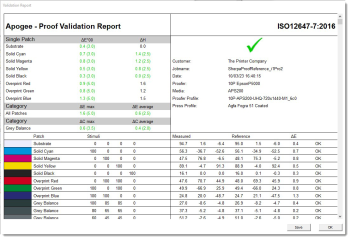
Validation
 |
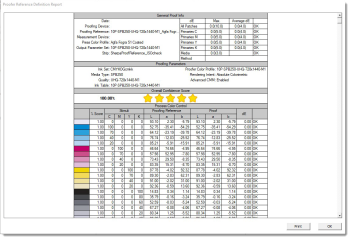
Apogee can create proofing jobs in which Automatic Proof Validation is enabled. In addition to being printed as a report on the ApogeeProof job, the results of these inline proof validations (using an Epson SpectroProofer) are saved in the QMS database and accessible through the QMS History option.
In order to determine whether all parameters are within the tolerance, as per the ISO12647-7 standard, a small strip is printed and measured during a proof validation. The report includes the engine, paper, quality, press profile, and color management setup, and it is compared with the reference press profile.
1 Double-click on a validation.
QMS displays the validation report. Validations that are successful are marked as green, and those that are unsuccessful are marked as red.
 |
doc. version 14.0.1